
FINANCIAL REVIEW
SUMMARY 2012 FINANCIAL HIGHLIGHTS
2012 € billion |
2011 € billion |
From inception € billion |
|
|---|---|---|---|
| Cash generation | |||
| Total cash generated | 4.51 | 5.09 | 10.60 |
| Disposal receipts | 2.80 | 3.63 | 6.83 |
| Non disposal income | 1.45 | 1.34 | 3.18 |
| Bond repayments | |||
| Senior bonds redeemed | 3.50 | 1.25 | 4.75 |
| Profitability | |||
| Operating profit before impairment | 0.83 | 1.28 | |
| Impairment charge | (0.52) | (1.27) | |
| Profit for the year | 0.23 | 0.24 | |
| Loan portfolio | |||
| Loans and receivables (gross) | 26.04 | 28.36 | |
| Impairment provision | 3.26 | 2.75 | |
| Loans and receivables (net of impairment) | 22.78 | 25.61 |
CASH GENERATION
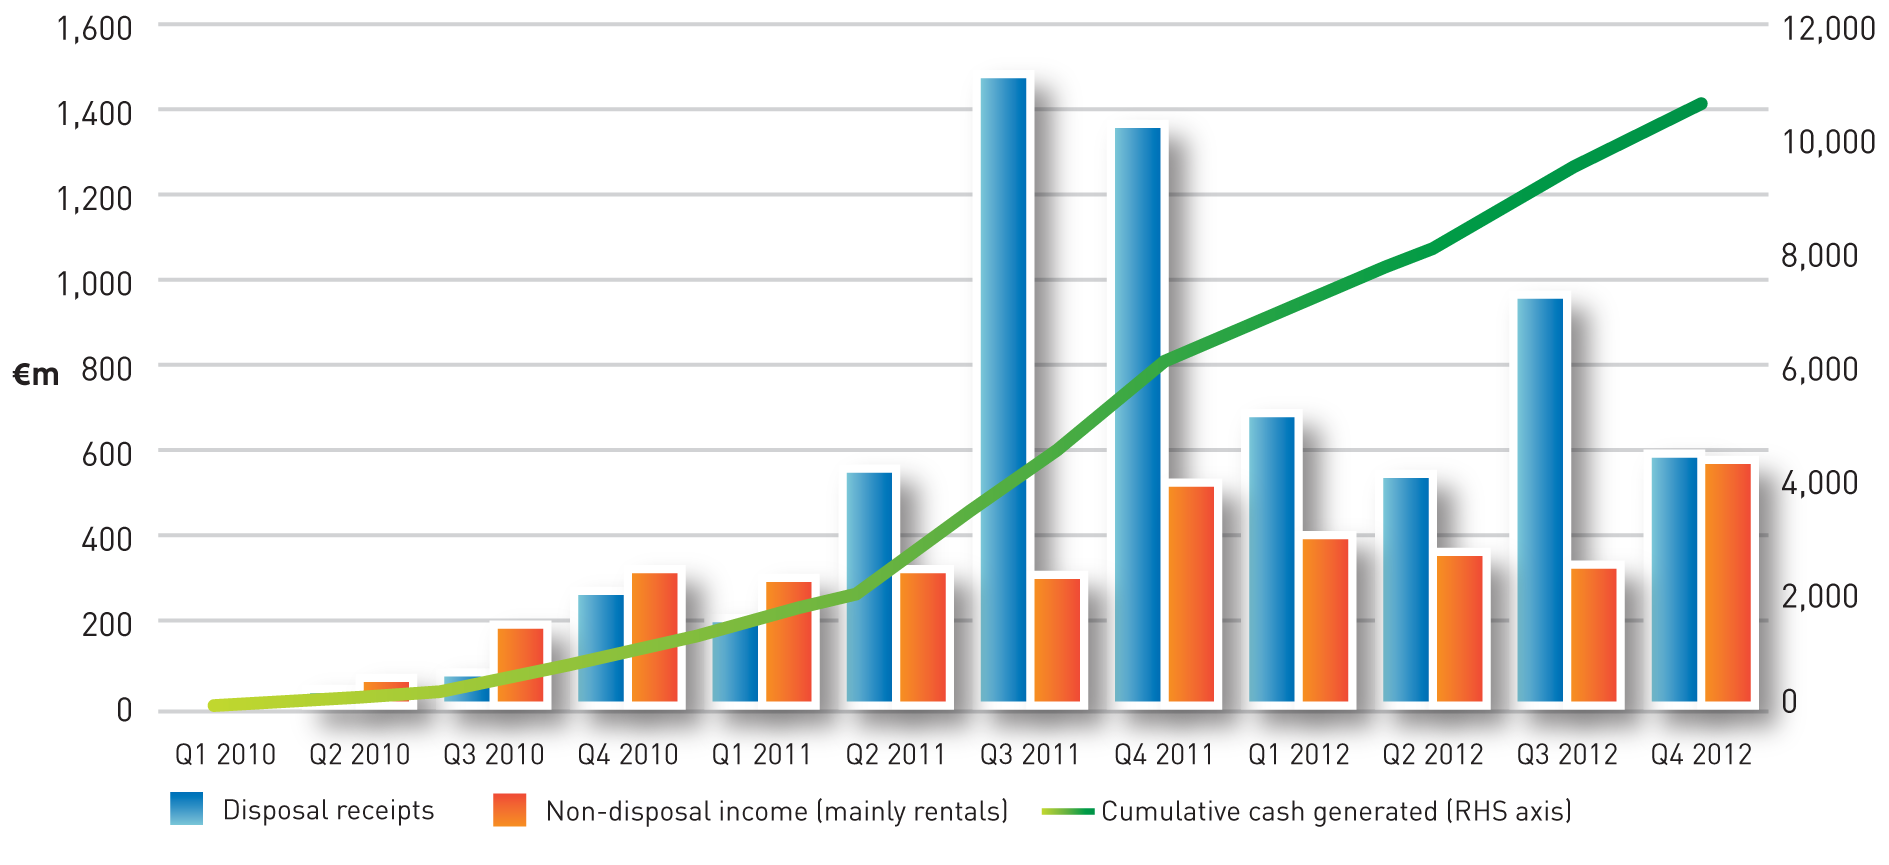
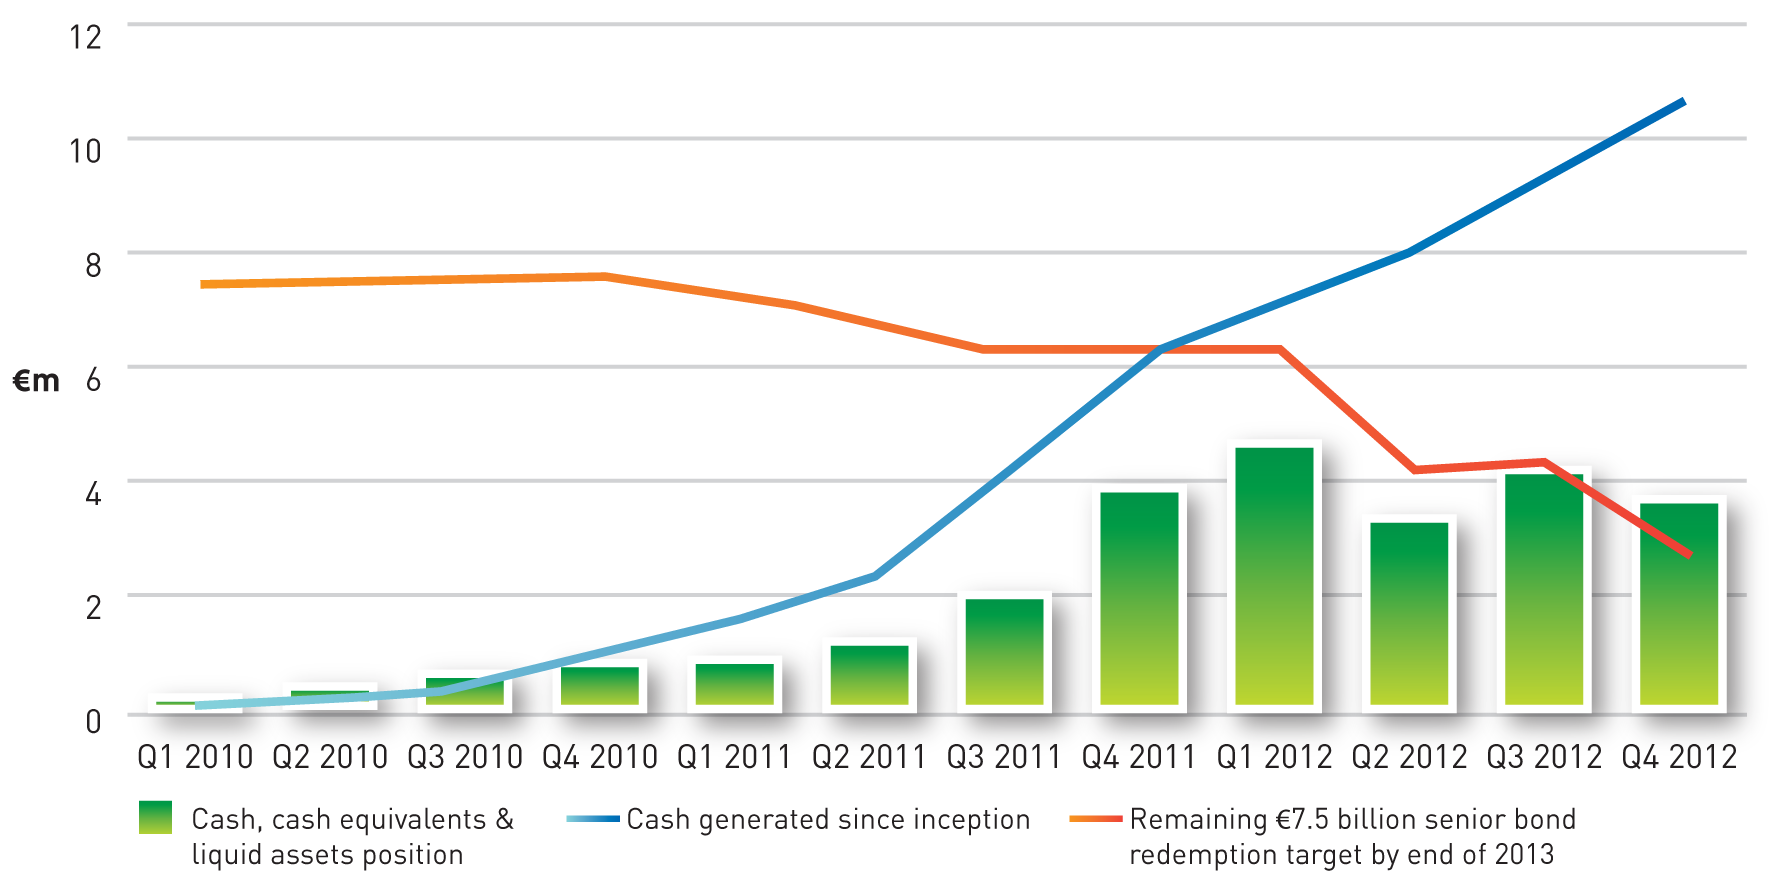
Cash generation is a critical measure of the progress being made by NAMA in meeting its stated objectives. During 2012, NAMA generated €4.5 billion in cash, bringing total cash generated from inception to end-2012 to €10.6 billion.
Cash is generated principally through disposal receipts and non-disposal income. Disposal receipts comprise the proceeds of both property collateral and loan sales. Non-disposal income represents income generated by debtor assets, principally rental income.
Table 4 and Figure K present NAMA's summary cashflow since inception.
2010 €m |
2011 €m |
2012 €m |
From inception €m |
|
|---|---|---|---|---|
| Opening cash, cash equivalents and liquid assets balance | - | 837 | 3,847 | - |
| Inflows | ||||
| Disposal receipts | 404 | 3,628 | 2,798 | 6,830 |
| Non disposal income | 390 | 1,340 | 1,453 | 3,183 |
| Other | 219 | 117 | 254 | 590 |
| 1,013 | 5,085 | 4,505 | 10,603 | |
| Outflows | ||||
| Bond redemption | - | (1,250) | (3,500) | (4,750) |
| Foreign exchange and debt servicing costs (net) | 13 | (329) | (745) | (1,061) |
| Capital drawdowns | (240) | (304) | (308) | (852) |
| Operating costs | (49) | (143) | (155) | (347) |
| (276) | (2,026) | (4,708) | (7,010) | |
| Initial funding | ||||
| Issue of share capital to external investors | 51 | - | - | 51 |
| Net advance / (repayment) to the exchequer | 49 | (49) | - | - |
| 100 | (49) | - | 51 | |
| Closing cash, cash equivalents and liquid assets balance | 837 | 3,847 | 3,644 | 3,644 |
| FIGURE K: NAMA Cash generation from inception |
|---|
 |
NAMA's success in generating €10.6 billion in 33 months can be attributed to notable achievements in the following core business areas:
- Early action taken by NAMA to devise and implement workout strategies across its entire debtor portfolio - NAMA acted quickly to fix the significant debtor business problems that it had inherited and to put in place a robust platform to manage debtors and receivers.
- The capture of non-disposal income, averaging in excess of €100m per month, much of which would not otherwise have been applied to debt repayment.
- Intensive ongoing management of debtors and receivers to ensure adherence to milestones set by NAMA, including property disposal milestones.
- Intensive management of assets so as to derive incremental value from assets prior to disposal.
DISPOSAL RECEIPTS
One of NAMA's primary activities is the origination and management of property and loan disposal transactions. Disposal receipts during 2012 totalled €2.8 billion (2011: €3.6 billion), comprising property collateral disposals of €2.3 billion (2011: €2.7 billion) and loan sale transactions of €0.5 billion (2011: €0.9 billion), bringing total disposal receipts to €6.8 billion since inception.
During 2012, there were over 1,400 property disposal transactions (2011: 1,275) and 13 loan sale transactions (2011: 4). From inception to date, there have been 3,134 property disposal transactions and 17 loan sales (par value of €2.5 billion).
Table 5 and Figure L provide a breakdown of the number of transactions by value.
| <€10m | >€10m | 2012 total |
<€10m | >€10m | Inception total |
|
|---|---|---|---|---|---|---|
| Total disposals (€m) | 797 | 2,001 | 2,798 | 1,817 | 5,013 | 6,830 |
| No. of transactions | 1,360 | 57 | 1,417 | 3,034 | 117 | 3,151 |
| Average disposal value (€000) | 586 | 35,097 | 1,975 | 599 | 42,850 | 2,168 |
| FIGURE L: Analysis of disposal transactions by value and volume |
|---|
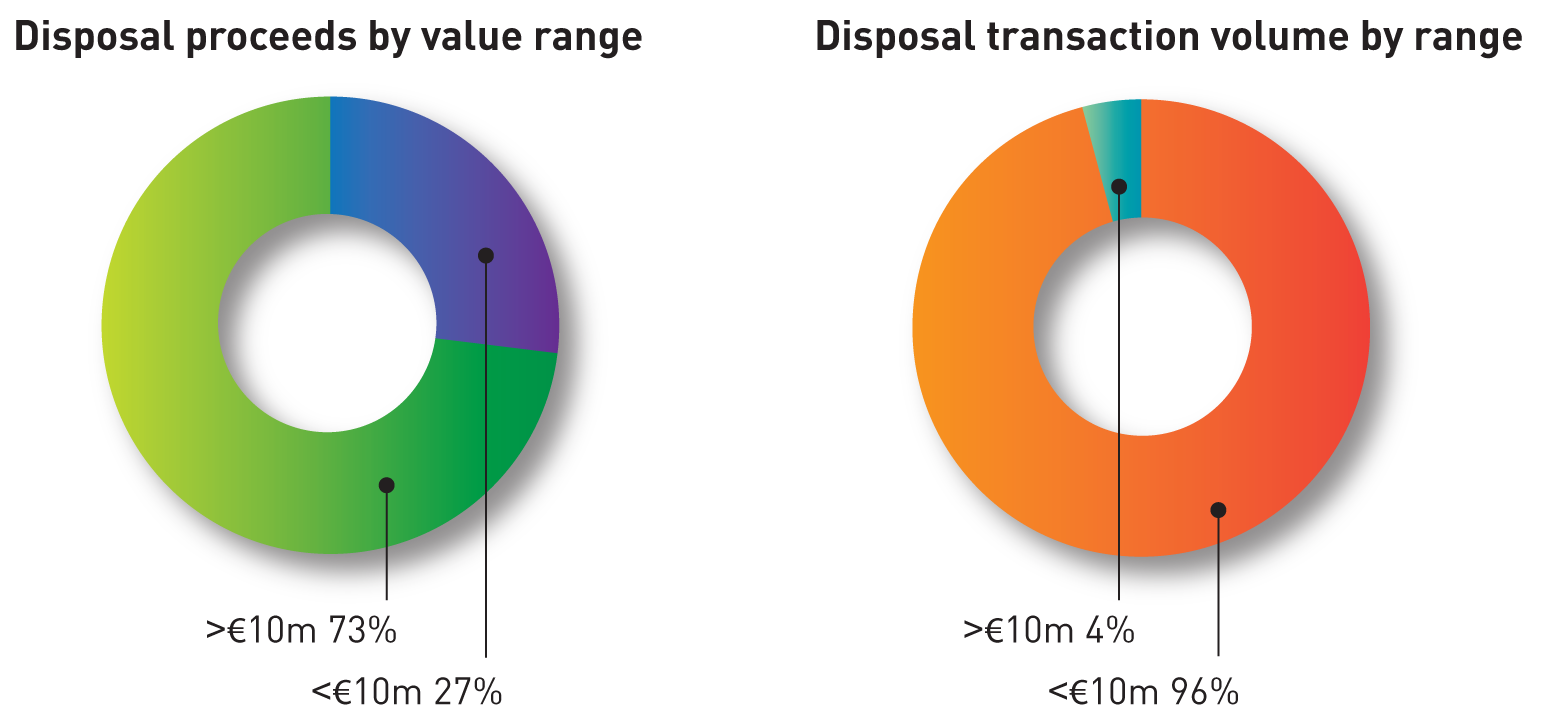 |
Figure M provides a breakdown of asset disposals by location. As highlighted, a significant proportion of disposal receipts have been generated by property disposal and loan sale transactions in the UK market, particularly in London. Disposal receipts relating to British assets amounted to €5.4 billion by end-2012 (79% of overall disposal receipts).
| FIGURE M: Analysis of disposals by location |
|---|
 |
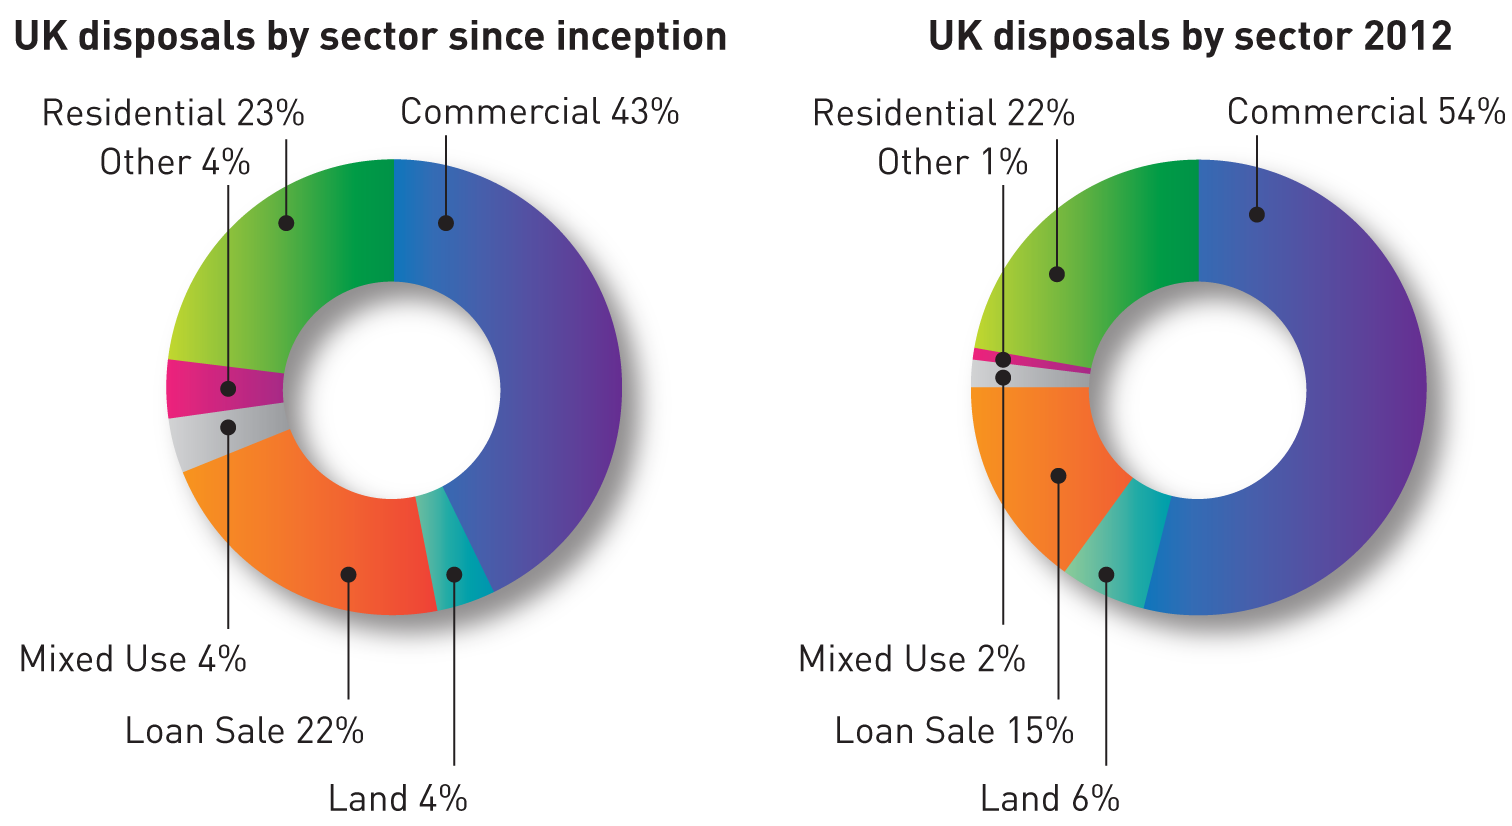
Figure N shows an analysis of UK disposals since inception and for 2012. 65% of UK disposal receipts to date relate to commercial property and loan sale transactions.
| FIGURE N: Analysis of UK disposals |
|---|
 |
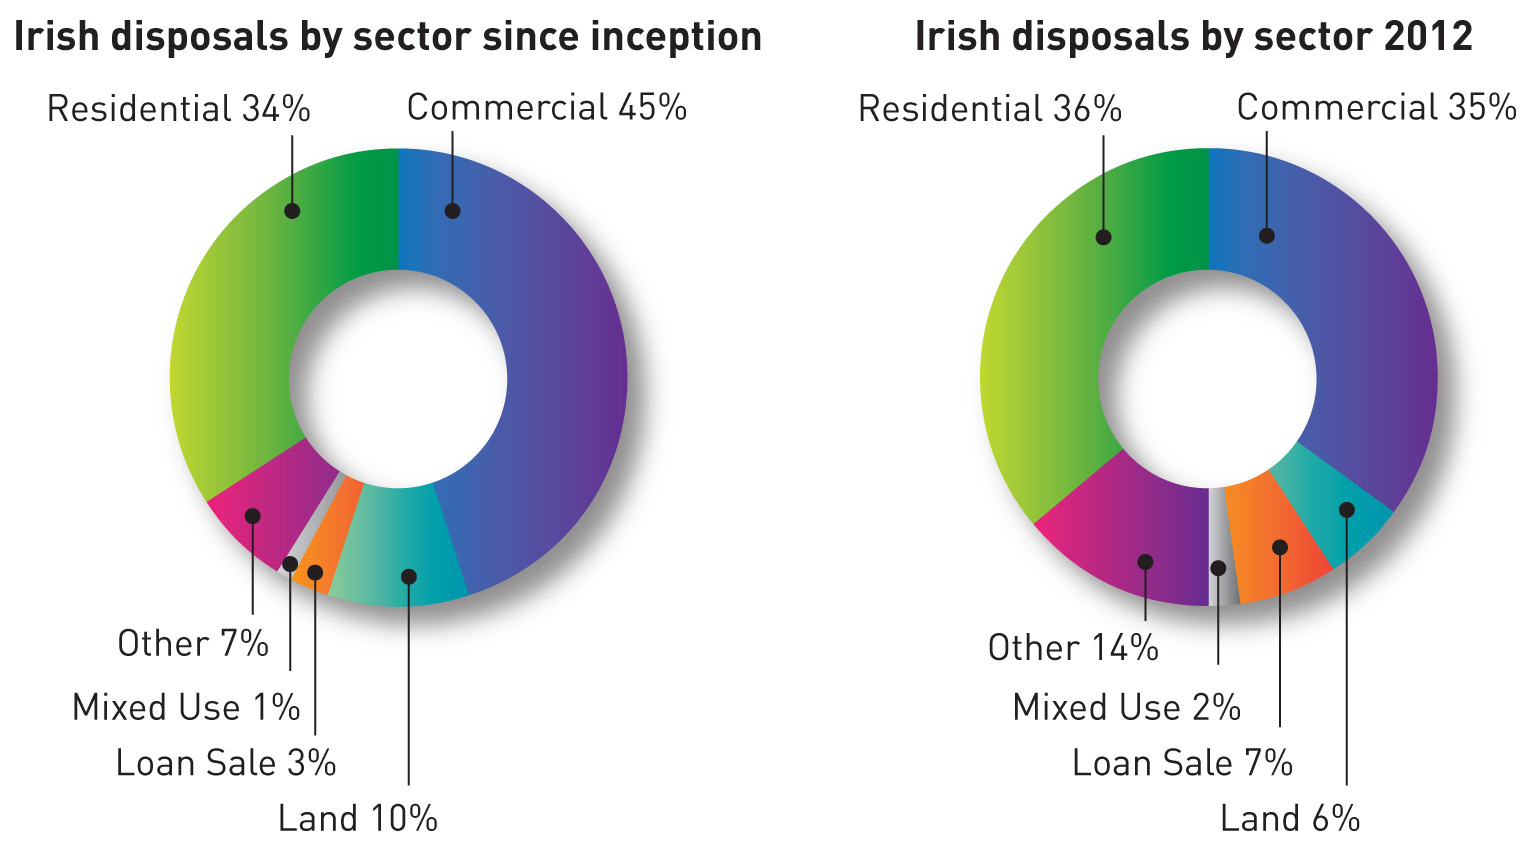
As highlighted in Figure O, 45% of Irish asset disposals to date relate to commercial property sales and 34% to residential property sales.
| FIGURE O: Analysis of Irish disposals |
|---|
 |
NON-DISPOSAL INCOME
One of NAMA's key objectives is to manage assets so as to optimise, and capture for debt servicing purposes, their income-producing potential through the generation and collection of rental and other income. The capture and collection of such income was not common prior to NAMA's acquisition of the loans; indeed, there appears to have been a significant and widespread leakage of funds. NAMA has robustly addressed this issue by implementing strategies and operating structures to ensure capture of this income and has, as a result, generated substantial incremental non-disposal income from its portfolio.
Cash generated during 2012 included recurring non-disposal income of €1.45 billion (2011: €1.34 billion). Performance in this respect remains strong notwithstanding the disposal of some €7.2 billion of assets by end-March 2013.
PROFITABILITY
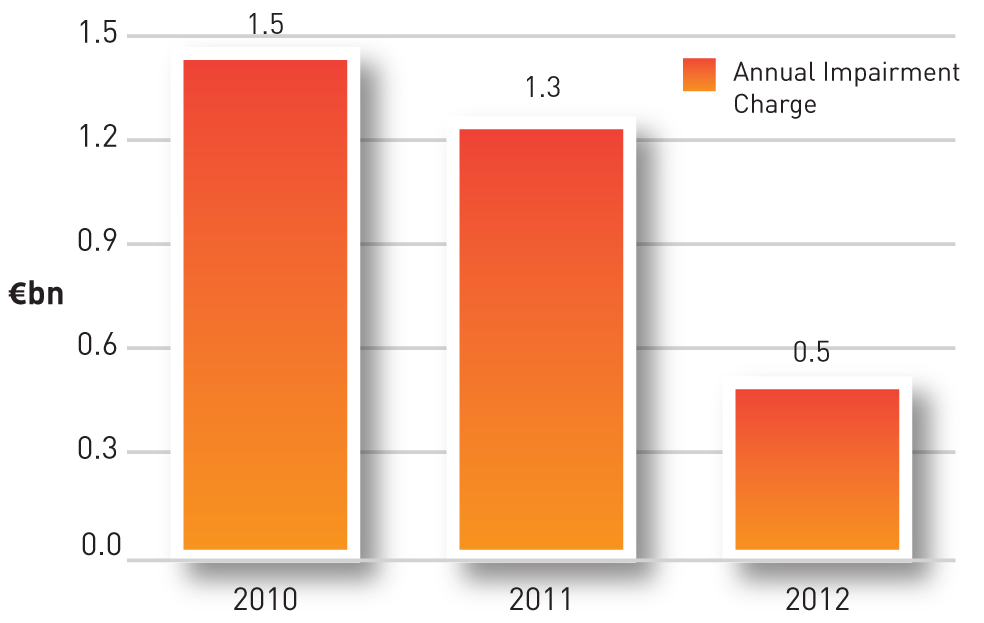
NAMA recorded an operating profit before impairment of €826m in 2012 (2011: €1,278m). An incremental impairment charge of €518m (2011: €1,267m) was recorded in 2012 mainly reflecting the fact that the property environment in Ireland remained challenging during the year. NAMA has now recorded a cumulative impairment provision of €3.3 billion.
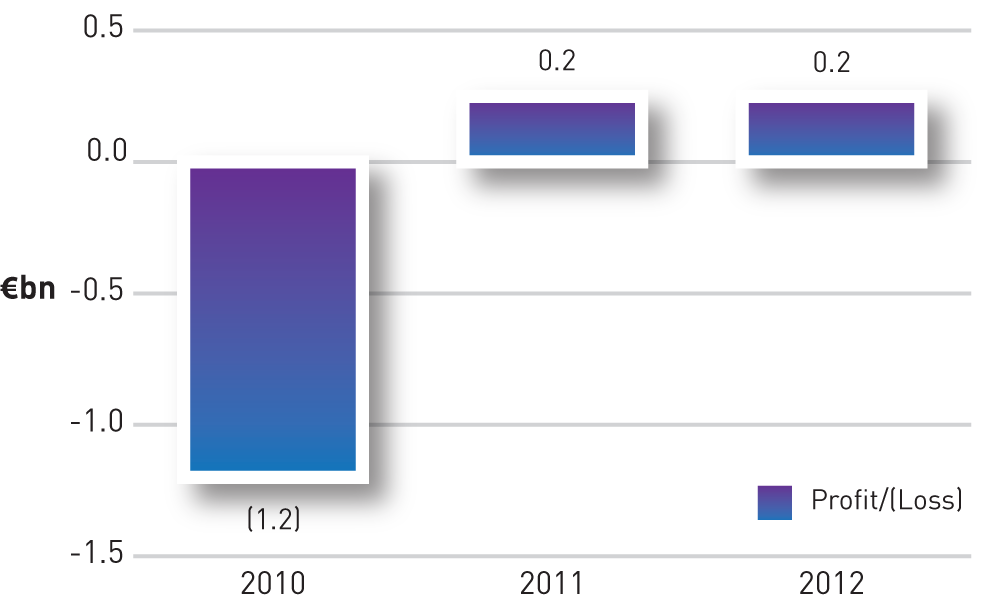
The overall result was a profit of €228m for 2012 (2011: €241m).
Income statement |
2012 €m |
2011 €m |
|---|---|---|
| Interest and fee income | 1,387 | 1,283 |
| Interest expense | (493) | (512) |
| Net interest income | 894 | 771 |
| Net profit on loans and property disposals | 188 | 549 |
| Foreign exchange (loss)/gain | (99) | 62 |
| Derivatives (loss)/gain | (38) | 24 |
| Administration expenses | (119) | (128) |
| Operating profit before impairment | 826 | 1,278 |
| Impairment charge | (518) | (1,267) |
| Profit for the year before tax | 308 | 11 |
| Tax (charge)/credit | (76) | 235 |
| Dividends | (4) | (5) |
| Profit for the year after tax and dividends | 228 | 241 |
As illustrated in Figure P which highlights NAMA's profit/(loss) from inception, NAMA has reported its second successive year of profit.
Figure Q outlines the impairment charge recorded by NAMA since inception and illustrates that, while NAMA has recorded an incremental impairment charge of €518m in 2012, the level of impairment has reduced significantly when compared to previous years.
| FIGURE P: NAMA Profit/Loss 2010 - 2012 |
|---|
 |
| FIGURE Q: NAMA impairment 2010 - 2012 |
|---|
 |
The increase in net interest income from €771m in 2011 to €894m in 2012 was primarily attributable to higher interest earned on loans and receivables and to lower debt servicing costs due to falling interest rates. The Euribor interest coupon on NAMA's Senior Bonds fell by 120 basis points from 1.747% at the start of 2012 to 0.544% at the end of the year.
Interest and fee income of €1,387m includes income on loans and receivables of €1,222m, which was recognised in accordance with the Effective Interest Rate (EIR) method as prescribed by accounting standards. 100% of the interest income recognised in the year in accordance with the EIR method was realised in cash.
Net profit on loans and property disposals of €188m in 2012, comprises profits and losses on disposal of loans and property assets of €16m and surplus income of €172m. Of the €172m, €108m relates to surplus loan repayments to NAMA, representing cash receipts in excess of the carrying value of the related loans.
The €99m foreign exchange loss recorded in 2012 reflects market movements in respect of foreign currency derivatives during the year. On a cumulative basis since 2010, NAMA has recorded a loss of €15m. This cumulative net cost is akin to an 'insurance' cost of protecting NAMA from the impact of foreign exchange rate fluctuations. NAMA does not enter speculative derivative positions.
Administration expenses have reduced from €128m in 2011 to €119m in 2012. The level of costs in 2012 represents 2.6% of cash generated during the period which compares favourably with comparable international institutions. A breakdown of administration expenses for the period is provided in Table 7.
| 2012 €'m |
2011 €'m |
|
|---|---|---|
| Primary and master servicer fees | 60 | 60 |
| NTMA as service provider | 37 | 28 |
| Due diligence costs (net of recovered amounts) | 4 | 10 |
| Portfolio management fees | 7 | 16 |
| Legal fees | 5 | 9 |
| Finance and technology costs | 3 | 2 |
| Other costs | 3 | 3 |
| Total operating costs | 119 | 128 |
The largest single expense was €56.4m, payable to the PIs as primary servicers. This equated to 8 basis points of the nominal loan balances administered by them in 2012.
NAMA has no employees. All staff assigned to NAMA are employed by the NTMA and the costs are recharged to NAMA by the NTMA as a service provider. NAMA salary costs comprised €27m of the total 2012 recharge from the NTMA.
Following completion of its year-2012 impairment review, NAMA has recorded a cumulative impairment provision of €3.3 billion against its loans and receivables portfolio; this entails that an additional impairment charge of €0.51 billion be applied to the 2012 income statement.
Table 8 summarises the results of the year-end impairment review and provision.
| Carrying Value1at 31/12/2012 |
2012 Impairment provision |
2011 Impairment provision |
Movement |
Impairment coverage |
|
|---|---|---|---|---|---|
| Impaired Portfolio | 14,329 | 2,751 | 2,059 | 692 | 19.2% |
| Unimpaired Portfolio | 7,922 | - | 94 | (94) | N/A |
| Individually Assessed Portfolio | 22,251 | 2,751 | 2,153 | 598 | 12.4% |
| Collectively Assessed Portfolio | 4,111 | 512 | 598 | (86) | 12.5% |
| Overall Portfolio | 26,362 | 3,263 | 2,751 | 512 | 12.4% |
Note 1: The carrying value includes the carrying value of debtor loans and derivatives
Impairment is a key area of judgement in NAMA's financial statements. NAMA acquired a portfolio of loans where the vast majority were already impaired by reference to the November 2009 valuation date.
The incremental impairment provision of €598m in respect of the individually assessed portfolio is analysed in Table 9.
| €m | |
|---|---|
| Increase in specific provision | 1,017 |
| Release of specific provision | (419) |
| Total | 598 |
The release of the specific impairment provision of €0.4 billion in 2012 primarily relates to a reduction in the initial carrying value of loans for certain debtor connections following the completion of due diligence on those loans during the year and the finalisation of consideration paid to PIs.
The year-end impairment review was based on:
- A detailed assessment of expected future cash flows for all debtor connections which are considered individually significant. These comprised 187 debtor connections with loans and related derivatives with a carrying value of €22.3 billion (2011 €23.5 billion), representing all of the NAMA-managed debtor connections apart from a small number where circumstances did not allow the preparation of cash flow estimates.
- The expected future cash flows represent NAMA's best estimate of expected future cash flows for each individually significant debtor. They include estimated cash flows arising from the disposal of property collateral and non-disposal income (such as rental income).
- A collective loss assessment was performed on the remaining loan book, taking into account the loss levels evident in the individually assessed portfolio. The remaining loan book, representing a carrying value of €4.1 billion, relates to debtors principally managed by PIs which have not been individually assessed and which are grouped into a single portfolio for collective assessment.
The additional impairment charge for 2012 reflects on-going challenging conditions in the Irish property market where property values in 2012 continued to fall across most sectors and the level of market activity remained relatively low. While recognising that Irish property prices have declined on average by the order of 25%-30% since November 2009, it would be overly simplistic and inaccurate to presume that this rate of decline applies evenly across NAMA's portfolio.
As is evident from Figures A, B and C (click here), much of the residual portfolio is well located within Ireland and the UK. It is also notable that a number of property assets (including many Irish assets) have outperformed the relevant property indices since acquisition due to their unique individual characteristics and to positive asset management initiatives (for example, elimination of vacancies, commencement of development activity, etc).
The tax charge in the period of €76m reflects primarily the partial release of deferred tax assets recognised on unutilised tax losses in 2011. The balance of €133m is expected to be released in 2013 and 2014.
BALANCE SHEET
| 2012 €m |
2011 €m |
|
|---|---|---|
| Assets | ||
| Cash and cash equivalents and liquid assets | 3,644 | 3,847 |
| Loans and receivables | 22,776 | 25,607 |
| Derivative financial instruments | 351 | 449 |
| Deferred tax | 337 | 306 |
| Other assets | 120 | 460 |
| Total assets | 27,228 | 30,669 |
| Liabilities and reserves | ||
| Senior debt securities | 25,440 | 29,106 |
| Derivative financial instruments | 1,169 | 729 |
| Other liabilities | 207 | 312 |
| Total liabilities | 26,816 | 30,147 |
| Equity and reserves | ||
| Shareholders Equity | 934 | 714 |
| Other Reserves | (522) | (192) |
| Total equity and reserves | 412 | 522 |
| Total equity and liabilities | 27,228 | 30,669 |
DEBT REDUCTION
As highlighted in Figure R, NAMA is on target to achieve its Senior Bond redemption target of €7.5 billion by the end of 2013. €3.5 billion of Senior Bonds were redeemed in 2012, bringing the cumulative redemption to €4.75 billion which is 63% of the end-2013 target.
| FIGURE R: Cash generation versus bond redemption target |
|---|
 |
LOAN PORTFOLIO
NAMA acquired loans with an original par debt value of €74 billion from the PIs for a consideration of €31.8 billion. The NAMA carrying value of the loans at end-2012 is €22.8 billion (net of the cumulative €3.3 billion impairment provision).
Table 11 provides a summary of the movement in the loan portfolio during the period.
| NAMA Debt 2012 €m |
Par Debt 2012 €m |
NAMA Debt 2011 €m |
Par Debt 2011 €m |
|
|---|---|---|---|---|
| Loans and receivables - opening balance | 25,607 | 72,463 | 27,951 | 71,111 |
| Cash receipts (note 1) | (4,176) | (4,176) | (4,867) | (4,867) |
| Interest income | 1,222 | 2,430 | 1,145 | 2,801 |
| Loan acquisitions / valuation adjustments | (118) | 63 | 1,644 | 2,856 |
| Advances | 308 | 308 | 304 | 304 |
| Profit on loans and property disposals | 188 | - | 549 | - |
| Loan sale movement | (5) | (947) | - | (98) |
| Debt Comprise/Write-off | - | (55) | - | (118) |
| Foreign exchange and other movements | 262 | 726 | 148 | 474 |
| Loans and receivables pre-impairment | 23,288 | 70,812 | 26,874 | 72,463 |
| Impairment provision - incremental charge | (512) | - | (1,267) | - |
| Loans and receivables - closing balance | 22,776 | 70,812 | 25,607 | 72,463 |
Note 1 - the loan movements table includes the cash movements on loans and receivables only. It does not include cash received on performing borrower derivatives during 2012.
As highlighted below in Table 12, the underlying performance of the loan portfolio, on a weighted average cash flow basis, of fully performing and part performing loans, is 33% at 31 December 2012.
| Non disposal receipts €m |
Par Debt at 31/12/12 €m |
Cashflow weighted average performance |
|
|---|---|---|---|
| Full performing loans | 762 | 12,412 | |
| Partially and non-performing loans (including enforced loans) | 691 | 58,400 | |
| Total | 1,453 | 70,812 | 33% |
When NAMA acquired its loans, the majority of the loans were non-performing by reference to the original loan facility terms. NAMA measures its performance by reference to the extent to which it captures non-disposal income and not by reference to the extent to which its debtors are in compliance with the legacy facility agreements which predate NAMA.