Financial Review
Summary 2014 Financial Highlights
| Financial Highlights | 2014 €m |
2013 €m |
From Inception €m |
|---|---|---|---|
| Cash Generation | |||
| Total cash generated | 8,562 | 4,480 | 23,646 |
| Disposal receipts | 7,757 | 3,672 | 18,627 |
| Non disposal income | 809 | 792 | 4,416 |
| Senior Bond Repayments | |||
|---|---|---|---|
| Senior bonds redeemed | 9,100 | 2,750 | 16,600 |
| Profitability | |||
|---|---|---|---|
| Operating profit before impairment | 648 | 1,198 | |
| Impairment charge | (137) | (914) | |
| Profit for the year | 458 | 213 | |
| Loan Portfolio | |||
|---|---|---|---|
| Total loans and receivables (net of impairment) | 13,360 | 19,598* |
Cash Generation
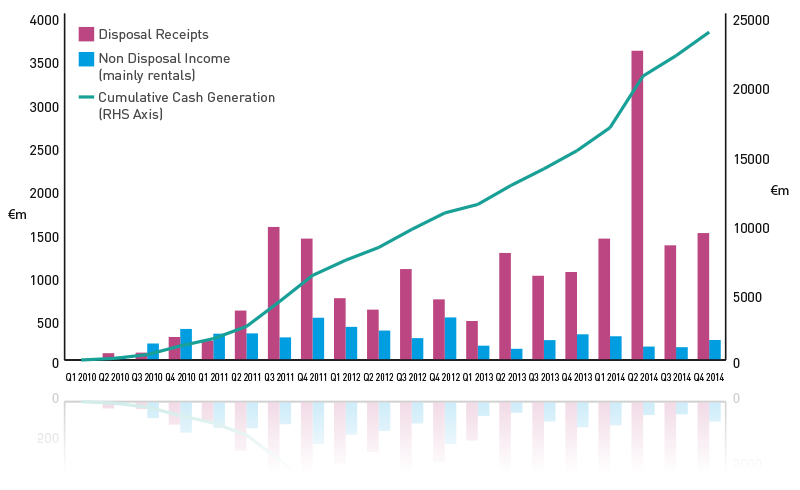
Cash generation is a critical measure of the progress being made by NAMA in meeting its stated objectives. During 2014, NAMA Group (excluding NARL) generated €8.6 billion (2013: €4.5 billion) in cash, bringing total cash generated from inception to end-2014 to €23.7 billion.
Cash is generated principally through disposal receipts and non-disposal income. Disposal receipts comprise the proceeds of both property collateral and loan sales. Non-disposal income represents income generated by debtor assets, principally rental income.
Total cash generated is used to repay NAMA’s Senior Bonds and to fund NAMA’s administration expenses, debt servicing costs and advances to debtors.
FIGURE N: NAMA Cash generation since inception (excluding NARL)
NAMA’s significant cash flow generation since inception and in 2014 reflects the Agency’s continued active management of its loan portfolio including:
- Significant acceleration of disposal activity in response to a step-change improvement in the Irish property market.
- Intensive ongoing management of its debtors and receivers to ensure adherence to milestones set by NAMA, including property disposal milestones.
- Intensive management of assets so as to derive incremental value prior to disposal.
- Proactive engagement with potential investors and purchasers of NAMA loans to maximise sales proceeds from loan or portfolio asset sales.
TABLE 4: NAMA’s summary cash flow since inception:
| Cash Flow Generation | 2014 €m |
2013 €m |
From Inception €m |
|---|---|---|---|
| Opening cash balance | 4,400 | 3,644 | - |
Inflows |
|||
| Disposal receipts | 7,757 | 3,672 | 18,627 |
| Non disposal income | 809 | 792 | 4,416 |
| Repayments from joint Special Liquidators – NARL | 11,788 | 1,414 | 13,202 |
| Other | (3) | 16 | 604 |
| Total cash generated | 20,351 | 5,894 | 36,849 |
| Outflows | |||
| Foreign exchange and debt servicing | (798) | (579) | (2,497) |
| Loan advances to borrowers | (892) | (665) | (2,417) |
| Operating costs and other | (184) | (144) | (558) |
| Total operational outflows | (1,874) | (1,388) | (5,472) |
| Net cash generated | 18,477 | 4,506 | 31,377 |
| Debt reduction | |||
| Senior Bond redemptions - NAMA | (9,100) | (2,750) | (16,600) |
| Senior Bond redemptions - NARL | (11,928) | (1,000) | (12,928) |
| Closing cash, cash equivalents and liquid assets | 1,849 | 4,400 | 1,849 |
Disposal receipts
One of NAMA’s primary activities is the origination and management of property and loan disposal transactions. Disposal receipts during 2014 totalled €7.8 billion (2013: €3.7 billion), comprising property collateral disposals of €3.8 billion (2013: €3.2 billion), loan sale transactions of €3.4 billion (2013: €0.3 billion) and other disposal transactions (including the sale of unencumbered assets, non-real estate assets and loan redemptions) of €0.6m (2013: €0.2m). Disposal receipts from inception to end-2014 total €18.6 billion.
During 2014, there were 2,798 property disposal transactions (2013: 1,840) and 22 loan sale transactions (2013: 19). From inception to date, there have been almost 7,500 property disposal transactions and 60 loan sales.
There was a marked increase in the volume of loan sale transactions during 2014 – the larger transactions are listed here.
Non-disposal income
Cash generated during 2014 included non-disposal income of €809m (2013: €792m).
One of NAMA’s key objectives is to manage assets so as to optimise, and capture for debt servicing purposes, their income-producing potential through the generation and collection of rental and other income. The capture and collection of such income was not widespread prior to NAMA’s acquisition of the loans; indeed, there appears to have been a significant leakage of funds. By implementing strategies and operating structures to ensure capture of this income, NAMA has generated substantial incremental non-disposal income from its portfolio.
Furthermore, an integral part of NAMA’s day-to-day asset management activity is to ensure that vacant space is made available for rent, that lease terms are enhanced and that rental income is thereby maximised. These initiatives have played a major part in the generation of non-disposal income which has totalled €4.4 billion from inception to end March-2015.
Profitability
TABLE 4: NAMA’s summary cash flow since inception:
| 2014 €m |
2013 €m |
|
|---|---|---|
| Interest and fee income | 955 | 1,335 |
| Interest expense | (313) | (375) |
| Net interest income | 642 | 960 |
| Net profit on disposal of loans, property assets; and surplus income | 285 | 505 |
| Foreign exchange loss | (22) | (89) |
| Derivatives loss | (159) | (54) |
| Administration and other income / (expenses) | (98) | (124) |
| Operating profit before impairment | 648 | 1,198 |
| Impairment charge | (137) | (914) |
| Profit for the year before tax | 511 | 284 |
| Tax charge | (53) | (71) |
| Profit for the year | 458 | 213 |
NAMA recorded an operating profit before impairment of €648m in 2014 (2013: €1,198m). The overall result after tax was a profit of €458m for 2014 (2013: €213m). NAMA has reported its fourth successive year of profit. The 2014 impairment charge of €137m has reduced significantly from the €914m impairment charge that was recorded in 2013.
Net interest income
TABLE 6: Net interest margin - NAMA Group
| 2014 €m |
2013 €m |
|
|---|---|---|
| Interest and fee income | 955 | 1,133 |
| Interest expense | (313) | (341) |
| Net interest income | 642 | 792 |
| Cash generated from non-disposal income | 809 | 792 |
| NAMA average loans and receivables (net of impairment) | 16,479 | 21,187 |
| Net interest margin | 3.9% | 3.7% |
The decrease in net interest income from €792m in 2013 to €642m in 2014 is primarily due to the decline in loans and receivables balances. Interest income is recognised at a fixed rate of interest, which was set by reference to an estimation of cash flows carried out as part of NAMA’s due diligence in respect of its original loan portfolio. Interest income is not recognised on any impaired portion of a loan. Debt servicing costs, which includes the cost of hedge derivatives in place and the interest paid on Senior Bonds securities, increased in 2014 due to the impact of accelerated Senior Bond redemptions and the related increase in the interest cost of hedges in place against the Senior Bonds. Average debt servicing costs in 2014 were 1.54% (2013: 1.3%).
TABLE 7: Net profit on disposal of loans, property assets; and surplus income
| 2014 €m |
2013 €m |
From Inception €m |
|
|---|---|---|---|
| Surplus income on loan repayments in excess of debt | 572 | 531 | 1,748 |
| Net (loss)/profit on disposal of loan and property assets | (287) | (26) | (227) |
| Total net profit | 285 | 505 | 1,521 |
Net profit on disposal of loans, property assets; and surplus income of €285m in 2014 (2013: €505m), comprises losses on disposal of loans and property assets of €287m (2013: loss of €26m) which was offset by surplus income of €572m (2013: €531m).
NAMA acquired loans from the Participating Institutions at a significant discount to par value. The discounted acquisition value is the amount NAMA recognised on its balance sheet. Debtors are still required to repay the loan par value, which was originated with the Participating Institutions. Therefore NAMA has the potential to generate surplus cash if a debtor’s repayments exceed the NAMA acquisition price. Where this occurs any surplus cash generated is taken directly to the income statement as profit (or surplus income). As part of its impairment exercise, NAMA estimates the expected future cash flows to be generated from each debtor connection. Where the net present value of the expected future cash flows is less than the total debt in a debtor connection, an impairment provision is booked. Where the net present value of the expected future cash flows exceeds the total debt in a debtor connection, in limited circumstances where stringent stress conditions are met, the excess cash is recognised as profit (or surplus income) in the current reporting period. Following the results of its 2014 impairment exercise, the net present value of total expected cash flows exceeds the total debtor connection carrying value by over €1.9 billion, of which €330m was recognised in 2014. The remaining amount of approximately €1.6 billion, if maintained, will be recognised as profit (or surplus income) over the remaining life of NAMA.
TABLE 8: Summary of NAMA’s overall profit / loss recognised on the transactions relating to the disposal of underlying collateral and loans.
| 2014 | 2013 | Inception to end-2014 | |||||||
|---|---|---|---|---|---|---|---|---|---|
| Group | Disposals of underlying collateral €m |
Disposals of loans €m |
Total €m |
Disposals of underlying collateral €m |
Disposals of loans €m |
Total €m |
Disposals of underlying collateral €m |
Disposals of loans €m |
Total €m |
| Disposal proceeds | 5,138 | 3,424 | 8,562 | 4,186 | 294 | 4,480 | 18,537 | 5,109 | 23,646 |
| Profit / (loss) recognised in income statement |
572 | (290) | 283 | 531 | (29) | 502 | 1,748 | (226) | 1,522 |
| Crystallisation of existing impairment provision | (1) | (609) | (610) | (30) | (23) | (53) | (31) | (632) | (663) |
| Total profit/(loss) | 571 | (899) | (327) | 501 | (52) | 449 | 1,717 | (858) | 859 |
From inception to end-2014, NAMA generated profits of €0.9 billion from the disposal of loans and collateral held as security against loans acquired.
The crystallisation of existing impairment provisions represents the amount of the previously recognised impairment provision that is attributed to the disposal of underlying collateral and loans. It does not represent an income statement charge in the period of crystallisation. Instead, the income statement recognition occurred when the impairment provision was previously recorded. Combined with the ‘Profit / (loss) recognised in income statement’, it presents an overall profit / (loss) in respect of the disposal of underlying collateral and loans for the period.
Derivatives
NAMA, as part of its interest rate-risk management, has entered into derivatives to hedge its exposure to borrower derivative financial instruments acquired from the Participating Institutions. NAMA does not enter into speculative interest rate derivative positions. The €159m derivative loss recorded in 2014 (2013: €54m) reflects both market movements in respect of interest rate derivatives during the year and termination fees paid. During the year, NAMA recognised termination fees of €147.7m (including NARL €32.7m) on the early termination of certain interest rate swaps. These costs would have arisen as an interest expense in the future, but, due to the early termination of the swaps, the accelerated loss is being recognised in the current period. The swaps were in place to hedge NAMA’s interest rate risk arising from the Senior Bonds in issue. These swaps qualified for hedge accounting and gains/losses were previously recognised in the cashflow hedge reserve.
Following its review of strategy in early 2014, the Board revised its Senior Bond redemption targets with the aim of redeeming a minimum of 80% of its Senior Bonds by end-2016. Following Board approval, interest rate hedging was aligned to the revised strategy and this required the termination of interest rate swaps with nominal principal of €5.43 billion.
On acquisition of the loan facility deed and floating charge from IBRC, NARL entered into €1.9 billion of interest rate swaps to hedge its exposure to interest rate risk arising from the floating rate Senior Bonds issued to acquire the loan facility deed and floating charge. As the Senior Bonds have been repaid, the hedged item no longer exists and therefore the interest rate swaps were terminated during the year. A termination fee of €32.7m was paid in 2014. This has been recognised in the income statement as fair value losses on other derivatives.
At the reporting date, NAMA had residual interest rate swaps with nominal principal of €12.75 billion to hedge its exposure to interest rate risk arising from the Senior Bonds in issue (2013: €23 billion).
Net derivative interest income was €19m in 2014 (2013: €34m) for derivatives not designated into hedge relationships. Interest income on borrower acquired derivatives reduced throughout 2014 due to derivatives being sold or terminated in line with the disposal of the associated loans.
Administration expenses
Administration expenses amounted to €135m to the end of 2014. NAMA’s operating costs from inception, €615m, represents approximately 2.5% of cash generation, which compares favourably with comparable international institutions. A breakdown of administration expenses for the period is provided below.
TABLE 9: Operating costs and other expenses
| 2014 €m |
2013 €m |
Inception to end-2014 |
|
|---|---|---|---|
| NTMA as service provider | 54 | 41 | 175 |
| Primary and Master Servicer fees | 53 | 58 | 246 |
| Legal fees | 9 | 3 | 32 |
| IBRC integration | 7 | 7 | 14 |
| Portfolio management fees | 4 | 6 | 36 |
| Finance, communication and technology costs | 4 | 3 | 18 |
| Due diligence costs | - | - | 78 |
| Other operating costs | 4 | 6 | 16 |
| Total operating costs and other expenses | 135 | 124 | 615 |
The largest single expense was €54m (2013: €41m), payable to the NTMA as a service provider. Under Section 42 (4) of the Act, NAMA is required to reimburse the NTMA for the costs incurred by the NTMA in assigning staff and providing services to NAMA. Costs comprise staff costs of €41m (2013: €31m) and overheads and shared service costs of €13m (2013: €10m). The increase in staff costs is driven by an increase in headcount numbers during the year as NAMA increased the pace of deleveraging and created separate residential and SDZ delivery teams.
Primary and Master Servicer costs decreased in the year in line with reducing loan balances.
Legal fees relate to fees incurred in the ongoing management and support of debtors. 2014 saw a significant increase in the volume (34%) and complexity of transactions, thus resulting in an increase in legal fees incurred.
NAMA applies stringent cost control and budgeting processes. An annual budget is prepared and actual costs to budget are assessed quarterly and reviewed by the Finance and Operating Committee and the Board.
Tax
The tax charge in the period of €53m (2013: €71m) reflects the full release of deferred tax assets previously recognised in respect of unutilised tax losses and deferred tax on fair value gains and losses on derivatives. As a result of profit generated in the year, the entire remaining deferred tax asset on unutilised tax losses of €93m was released in 2014.
Impairment
Following completion of its 2014 impairment review, NAMA has recorded a cumulative impairment provision of €3.6 billion against its loans and receivables portfolio. An additional impairment charge of €137m was recorded in the 2014 income statement, which is a significant decrease from the 2013 impairment charge of €914m.
Loans and receivables assessed for impairment
TABLE 10: Loans and receivables assessed for impairment
| Carrying value at 31/12/2014 €m |
2014 Impairment provision €m |
2013 Impairment provision €m |
Movement €m |
Impairment coverage €m |
|
|---|---|---|---|---|---|
| Impaired portfolio | 10,581 | 3,446 | 3,303 | 143 | |
| Unimpaired portfolio | 5,997 | - | - | - | |
| Individually assessed portfolio | 16,578 | 3,446 | 3,303 | 143 | 21% |
| Collectively assessed portfolio | 78 | 75 | 822 | (747) | 96% |
| Total loans and receivables assessed for impairment |
16,656 | 3,521 | 4,125 | (604) | 21% |
Impairment is a key area of judgement in NAMA’s financial statements.
- A detailed assessment of expected future cash flows for all debtor connections which are considered individually significant. These comprised 627 debtor connections with loans and related derivatives with a carrying value of €16.6 billion (2013 €19.6 billion).
- The expected future cash flows represent NAMA’s best estimate of expected future cash flows for each individually significant debtor. They include estimated cash flows arising from the disposal of property collateral, loan sales and non-disposal income (such as rental income).
- During 2014 the majority of the debtor connections, both NAMA and PI/SP managed were individually assessed for impairment. This differed from 2013, when the majority of the individually assessed debtors related to NAMA-managed connections only and PI/SP managed connections were grouped together and collectively assessed for impairment.
The total movement in the impairment provision in 2014 was a reduction of €604m from €4,125m to €3,521m. Of this, €137m was recognised in the income statement as an increase in the charge for 2014 and €742m was recognised against loans and receivables arising predominantly from the crystallisation of impairment previously recognised against loans sold.
In 2013 NAMA commenced a process for the preparation of cash flow information for all PI-managed debtors. By 30 June 2014, full cash flow information was available to NAMA for the PI/SP managed portfolio and the impairment provisions for this portfolio were recognised at a debtor connection level rather than through the application of an overall loss rate to PI/SP-managed connections. In the case of debtor connections for whom detailed cash flows were not prepared as at 31 December 2014, representing €78m of the loan portfolio, these were grouped together and collectively assessed for impairment.
Financial Position
TABLE 11: Financial position 2014 and 2013
| Summary Balance Sheet | 2014 €m |
2013 €m |
|---|---|---|
| Assets | ||
| Cash and cash equivalents and liquid assets | 1,849 | 4,400 |
| Loans and receivables (net of impairment) | 13,360 | 31,314 |
| Other assets | 363 | 511 |
| Total assets | 15,572 | 36,225 |
| Liabilities and reserves | ||
| Senior bonds in issue | 13,590 | 34,618 |
| Other liabilities | 744 | 797 |
| Total liabilities | 14,334 | 35,415 |
| Total equity and reserves | 1,238 | 810 |
| Equity, reserves and liabilities | 15,572 | 36,225 |
Cash management
NAMA, under its Board-approved liquidity policy, must ensure that it has adequate cash resources to meet all its financial obligations as they fall due. Cash requirement levels vary during the financial year. As at 31 December 2014, the NAMA Group had cash and cash equivalents of €1.8 billion (2013: €4.4 billion). As at 31 December 2014, permitted liquid asset investments under the NAMA liquidity policy are short dated Irish Government securities.
Senior Bond redemptions
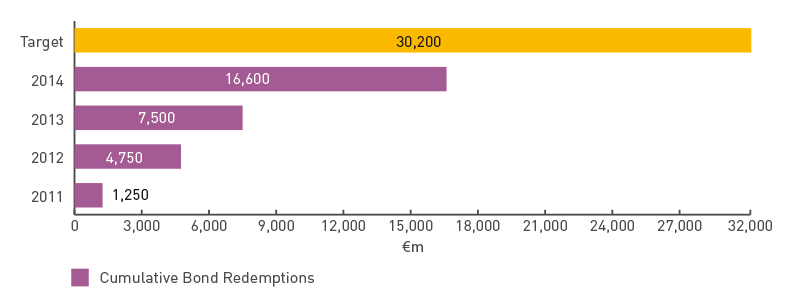
In redeeming €16.6 billion of Senior Bonds to the end of 2014, NAMA has exceeded its original target of redeeming, by end-2016, 50% of its original €30.2 billion Senior Bonds.
NAMA’s revised target is to redeem at least 80% of its Senior Bonds (€24 billion) by end-2016.
FIGURE O: Target Senior Bond redemption versus cumulative actual redemption
Loan portfolio
NAMA acquired loans with an original par debt value of €74 billion from the Participating Institutions for a consideration of €31.8 billion. The NAMA carrying value of the loans at end-2014 is €13.4 billion, net of the cumulative €3.6 billion impairment provision (2013: €19.6 billion, net of the cumulative €4.1 billion impairment provision).
TABLE 12: A summary of the movement in loans and receivables
| NAMA Debt 2014 €m |
NAMA Debt 2013 €m |
Par Debt 2014 €m |
Par Debt 2013 €m |
|
|---|---|---|---|---|
| Loans and receivables - opening balance | 19,598 | 22,776 | 67,140 | 70,812 |
| Cash receipts | (8,430) | (4,295) | (8,430) | (4,295) |
| Interest income | 844 | 1,058 | 1,729 | 1,973 |
| Loan acquisitions / valuation adjustments | 247 | 19 | 265 | 53 |
| Working capital advances | 645 | 665 | 645 | 665 |
| Profit on loan sales and surplus income | 294 | 502 | - | - |
| Par loan sale movement1 | - | - | (6,063) | (1,029) |
| Debt compromise/write off | (132) | - | (307) | (261) |
| Foreign exchange and other movements | 300 | (213) | 612 | (778) |
| Impairment crystallisations | (610) | (52) | - | - |
| Loans and receivables before impairment | 12,756 | 20,460 | 55,591 | 67,140 |
| Impairment provision - incremental charge | 604 | (862) | - | - |
| Loans and Receivables - closing balance | 13,360 | 19,598 | 55,591 | 67,140 |
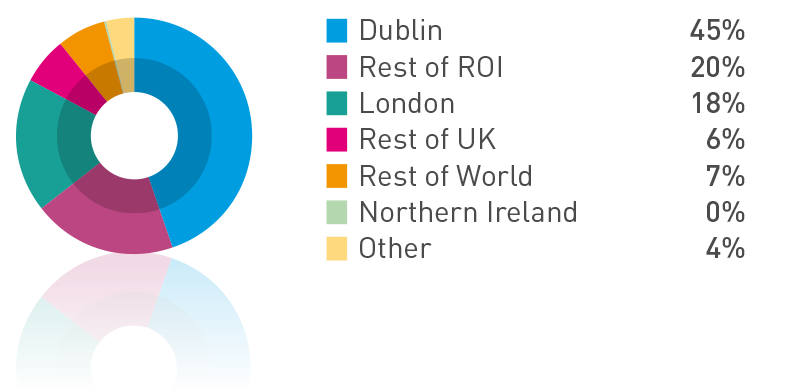
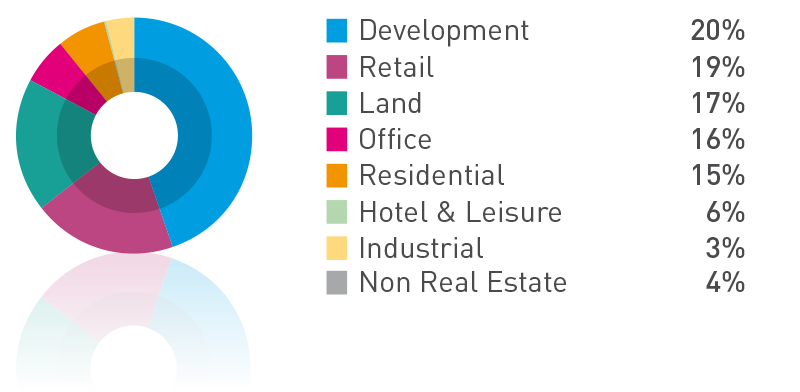
FIGURE P and Q: The concentration of NAMA’s remaining acquired loan portfolio at end-2014 by location and sector of the underlying collateral
NAMA must recover sufficient cash from its loan portfolio to repay its remaining Senior Bonds in issue. Total outstanding debt and equity issued by NAMA at end-2014 comprised €13.6 billion of Senior Bonds in issue, €1.6 billion of subordinated bonds and €99m of equity.
NAMA continually assesses its residual portfolio and expected cash flows from asset sales are updated on a weekly basis. Sales and cash flow data is aggregated and reported weekly to senior management. This detailed monitoring of cash flows enables NAMA to optimise its asset disposal activity.
The security underlying the NAMA portfolio is well located and concentrated in prime urban centres, with Dublin representing 45% and London 18% of the residual portfolio.
65% of the end-2014 portfolio is concentrated in Ireland. As a result, the performance of its Irish assets, and in particular those located in Dublin, will be a crucial factor in NAMA’s ultimate performance.
RATE OF RETURN BENCHMARK
During the year, the Board approved an Entity Return on Investment (‘EROI’) target benchmark of 20%. The projected return as at end-2014 was 24%.
The EROI benchmark is calculated based on the comparison of NAMA’s projected terminal surplus/(deficit) position, as per latest forecasted cashflows, with NAMA’s initial investment, as adjusted to exclude the €5.6 billion in State Aid which NAMA was required to pay to the Participating Institutions as part of the loan acquisition price.