FINANCIAL REVIEW
SUMMARY 2013 FINANCIAL HIGHLIGHTS
Cash generation |
2013 €m |
2012 €m |
From inception to end-2013 €m |
|---|---|---|---|
| Total cash generated | 4,480 | 4,505 | 15,084 |
| Disposal receipts3 | 3,672 | 3,041 | 10,870 |
| Non disposal income | 792 | 1,210 | 3,607 |
| Senior Bond Repayments | |||
|---|---|---|---|
| Senior bonds redeemed - NAMA | 2,750 | 3,500 | 7,500 |
| Profitability | |||
|---|---|---|---|
| Operating profit before impairment | 1,198 | 826 | |
| Impairment charge | (914) | (518) | |
| Profit for the year | 211 | 228 |
| Loan Portfolio | |||
|---|---|---|---|
| Total loans and receivables (net of impairment) | 31,314 | 22,776 | |
| NAMA Loans and receivables (net of impairment) | 19,598 | 22,776 | |
| IBRC loans and receivables (gross)4 | 11,716 | - |
SIGNIFICANT CASH GENERATION AND SENIOR BOND REPAYMENT
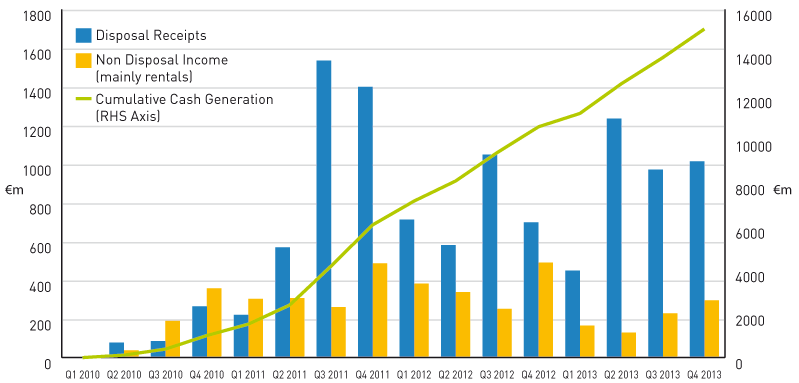
2013 was another year of outstanding commercial achievement for NAMA. During 2013, NAMA (excluding NARL) generated €4.5 billion (2012: €4.5 billion) in cash, bringing total cash generated from inception to end-2013 to €15.1 billion. This was a notable achievement given the difficult conditions which prevailed in the Irish economy and the Irish property market up to mid-2013 and the fact that NAMA has only been fully operational since 2012, having had to build an organisation from scratch.
Cash is generated principally through disposal receipts and non-disposal income. Disposal receipts comprise the proceeds of both property collateral and loan sales. Non-disposal income represents income generated by debtor assets, principally rental income.
The success in generating cash from assets meant that NAMA was in a position to attain the critical milestone of repayment of €7.5 billion of Senior Bonds by end-2013.
| FIGURE I: NAMA cash generation from inception to end-2013 (excluding NARL) |
 |
| NARL |
|---|
| On 11 February 2013, NAMA established National Asset Resolution Limited ('NARL') in response to a Direction issued by the Minister under the IBRC Act 2013 to NAMA to acquire from the Central Bank a loan facility deed and floating charge over certain IBRC assets. Consideration of €12.9 billion was paid to the Central Bank in the form of Government guaranteed Senior Bonds. During 2013, the IBRC Special Liquidators ('IBRC SL') initiated a process to sell the assets of IBRC to third parties. The sales proceeds are remitted to NAMA to reduce the outstanding loan facility. In turn, these cash proceeds are used by NAMA to redeem Senior Bonds issued to the Central Bank. During 2013, NAMA received principal and interest repayments of €1.4 billion from the IBRC SL. NARL's results are presented separately in the financial statements. The successful disposal of IBRC assets by the IBRC SL indicates that all bonds issued by NAMA to the Central Bank are likely to be redeemed in 2014. |
| Cash flow generation | NARL €m |
NAMA Group (excluding NARL) €m |
2013 NAMA Group Total €m |
2012 NAMA Group Total €m |
|---|---|---|---|---|
| Opening cash balance | - | 3,644 | 3,644 | 3,847 |
| Inflows | ||||
| Disposal receipts | - | 3,672 | 3,672 | 3,041 |
| Non disposal income | - | 792 | 792 | 1,210 |
| Repayments from Special Liquidators | 1,414 | - | 1,414 | - |
| Other | - | 16 | 16 | 254 |
| Total cash generated | 1,414 | 4,480 | 5,894 | 4,505 |
| Outflows | ||||
| Foreign exchange and debt servicing | (19) | (560) | (579) | (745) |
| Advances to borrowers | - | (665) | (665) | (308) |
| Operating costs and other | - | (144) | (144) | (155) |
| Total operational outflows | (19) | (1,369) | (1,388) | (1,208) |
| Net cash generated | 1,395 | 3,111 | 4,506 | 3,297 |
| Debt reduction | ||||
| Senior bond redemptions | (1,000) | (2,750) | (3,750) | (3,500) |
| Closing cash, cash equivalents and liquid assets | 395 | 4,005 | 4,400 | 3,644 |
NAMA's significant cash flow generation during 2013 and from inception reflects its active management of its loan portfolio and underlying assets, including:
- Intensive ongoing management of its debtors and Receivers to ensure adherence to milestones set by NAMA, including property disposal milestones.
- Intensive management of assets so as to derive incremental value from assets prior to disposal.
- Proactive engagement with potential investors and purchasers of NAMA loans to maximise sales proceeds from loan or portfolio asset sales.
DISPOSAL RECEIPTS
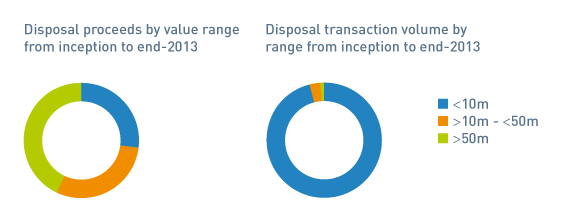
One of NAMA's primary activities is the initiation and management of property and loan disposal transactions. Disposal receipts during 2013 totalled €3.7 billion (2012: €3 billion), comprising property collateral disposals of €3.2 billion (2012: €2.5 billion), loan sale transactions of €0.3 billion (2012: €0.5 billion) and other disposal transactions (including the sale of non-real estate assets and loan redemptions) of €0.2m (2012: €nil) bringing total disposal receipts to €10.9 billion from inception.
During 2013, there were over 1,900 property disposal transactions (2012: 1,400) and 19 loan sale transactions (2012: 13). From inception to end-2013, there have been over 5,000 property disposal transactions and 32 loan sales.
| 2013 | From inception to end-2013 | ||||||||
|---|---|---|---|---|---|---|---|---|---|
| < €10m | >10m - < 50m |
> €50m | Total | < €10m | >10m - < 50m |
> €50m | Total | ||
| Total Disposals (€m's) | 1,028 | 1,138 | 1,506 | 3,672 | 2,969 | 3,277 | 4,624 | 10,870 | |
| No. of Transactions | 1,928 | 58 | 9 | 1,995 | 5,359 | 161 | 35 | 5,555 | |
| Average Disposal Value (€000's) | 533 | 19,621 | 167,333 | 1,841 | 554 | 20,354 | 132,114 | 1,957 | |
| FIGURE J: Analysis of disposals by value and volume from inception to end-2013 |
 |
Further details on asset disposals are provided in the Business Review section of this Report.
NON-DISPOSAL INCOME
Cash generated during 2013 included non-disposal income of €792m (2012: €1.2 billion).
One of NAMA's key objectives is to manage assets so as to optimise, and capture for debt servicing purposes, their income-producing potential through the generation and collection of rental and other income. The capture and collection of such income to apply towards loan interest and debt reduction was not common prior to NAMA's acquisition of the loans and there appears to have been a significant and widespread leakage of funds. By implementing strategies and operating structures to ensure capture of this income, NAMA has generated substantial incremental non-disposal income from its portfolio.
Furthermore, an integral part of NAMA's day-to-day asset management activity is to ensure that vacant space is made available for rent, that lease terms are enhanced and that rental income is thereby maximised. These initiatives have played a major part in the generation of non-disposal income which has totalled €3.6 billion from inception.
NARL
During 2013 NAMA received €1.4 billion of repayments of capital and interest from the IBRC SL in respect of the loan facility deed and floating charge it acquired from the Central Bank of Ireland following a Direction by the Minister for Finance under the IBRC Act.
PROFITABILITY
| 2013 €m |
2012 €m |
|
|---|---|---|
| Interest and fee income | 1,335 | 1,387 |
| Interest expense | (375) | (493) |
| Net interest income | 960 | 894 |
| Net profit on disposal of loans and property assets; and surplus income | 505 | 188 |
| Foreign exchange loss | (89) | (99) |
| Derivatives loss | (54) | (38) |
| Operating costs and other expenses | (124) | (119) |
| Operating profit before impairment | 1,198 | 826 |
| Impairment charge | (914) | (518) |
| Profit for the year before tax and dividend | 284 | 308 |
| Tax (charge)/credit | (71) | (76) |
| Dividends | (2) | (4) |
| Profit for the year | 211 | 228 |
NAMA recorded an operating profit before impairment of €1,198m in 2013 (2012: €826m). The overall result after tax and dividends was a profit of €211m for 2013 (2012: €228m). NAMA has reported its third successive year of profit, despite the recognition of an additional impairment provision of €914m.
NET INTEREST INCOME
| 2013 €m |
2012 €m |
2011 €m |
|
|---|---|---|---|
| Interest and fee income | 1,133 | 1,387 | 1,283 |
| Interest expense | (341) | (493) | (512) |
| Net interest income | 792 | 894 | 771 |
| Cash generated from non-disposal income | 792 | 1,210 | 1,242 |
| NAMA Loans and receivables (net of impairment) | 19,598 | 22,776 | 25,607 |
| Net interest margin | 4.0% | 3.9% | 3.0% |
Table 7 shows the net interest margin earned by NAMA on the original loan portfolio (excluding interest earned on the IBRC loan facility deed and interest payable on the NARL Senior Bonds). The fall in net interest income from €894m in 2012 to €792m in 2013 is primarily attributable to a reduction in the loan book (disposal of income-producing properties) and to higher impairment charges. Interest income is recognised at a fixed rate of interest (EIR) which was set by reference to an estimation of cash flows carried out as part of NAMA's due diligence in respect of its original loan portfolio. Interest income is not recognised on any impaired portion of a loan. Debt servicing costs (interest on Senior Bonds and derivatives) decreased due to a decrease in the 6 month Euribor rates reset in March 2013 and September 2013. Average debt servicing costs in 2013 were 1.3% (2012: 1.6%).
NET PROFIT ON DISPOSAL OF LOANS AND PROPERTY ASSETS; AND SURPLUS INCOME
| Cash flow generation | 2013 €m |
2012 €m |
|---|---|---|
| Surplus income on loan repayments in excess of debt | 531 | 172 |
| Net (loss)/profit on disposal of loans and property assets | (26) | 16 |
| Total net profit | 505 | 188 |
Net profit on disposal of loans and property assets; and surplus income aggregated to €505m in 2013 (2012: €188m) and comprises losses on disposal of loans and property assets of €26m (2012: €16m profit) together with surplus income of €531m (2012: €172m).
NAMA acquired loans from the PIs at a significant discount to the original value of loans originated. The discounted acquisition value is the amount initially recognised by NAMA on its balance sheet as being recoverable over its lifetime. Debtors are still under obligation to repay the original par debt. In cases where debtors generate surplus cash over the original discounted loan values, any such surplus is taken directly to the income statement as profit over acquisition value (or surplus income). As at 31 December 2013, NAMA estimated that it has an unrealised profit of approximately €0.9 billion in respect of such debtors, which if maintained, will be recognised as profit over the remaining life of NAMA.
OPERATING COSTS AND OTHER EXPENSES
| 2013 €m |
2012 €m |
|
|---|---|---|
| Primary and Master Servicer fees | 58 | 60 |
| NTMA as service provider | 41 | 37 |
| IBRC Integration | 7 | - |
| Due diligence costs (net of recovered amounts) | - | 4 |
| Portfolio management fees | 6 | 7 |
| Legal fees | 3 | 5 |
| Finance, communication and technology costs | 3 | 3 |
| Other operating costs | 6 | 3 |
| Total Operating Costs and other expenses | 124 | 119 |
A breakdown of operating costs and other expenses is provided in Table 9 above. Operating costs and other expenses were €124m in 2013 (2012: €119m). The level of costs represents 2% (2012: 2.6%) of total cash generated during the period which compares favourably with comparable international benchmarks.
NAMA applies stringent cost control and budgeting processes. An annual budget is prepared and actual costs to budget are assessed quarterly and reviewed by the Finance and Operating Committee and the Board.
Following the IBRC liquidation in February 2013, NAMA incurred total costs of €13m which arose as a result of the liquidation. Costs of €7.4m were incurred in transitioning the primary and special servicing of the existing portfolio of €41 billion (PAR debt) from IBRC to Capita. A further €5.7m (including €3.5m in staff costs) was incurred in direct and overhead costs in preparation for the acquisition of any unsold loan assets from the IBRC SL. These costs could not have been anticipated when the 2013 budget was approved by the Board in late 2012. Excluding these exceptional one-off costs, NAMA's operating costs in 2013 were €111m, which compared favourably to a budget of €140m and to 2012 costs of €119m.
IMPAIRMENT
Following completion of its 31 December 2013 impairment review, NAMA has recorded a cumulative impairment provision of €4.1 billion against its loans and receivables portfolio; this means that an additional impairment charge of €914m has been recognised in the 2013 income statement.
| Carrying value at end-2013 €m |
|
|---|---|
| Total loans and receivables | 35,439 |
| Analysed as: | |
| Loans and receivables with no objective evidence of impairment | 12,270 |
| Loans and receivables assessed for impairment | 23,169 |
| Total | 35,439 |
LOANS AND RECEIVABLES ASSESSED FOR IMPAIRMENT
| Carrying value at end-2013 €m |
2013 Impairment Provision €m |
2012 Impairment Provision €m |
Movement €m |
Impairment Coverage % |
|
|---|---|---|---|---|---|
| Impaired portfolio | 15,789 | 3,303 | 2,629 | 674 | |
| Unimpaired portfolio | 3,804 | - | 122 | (122) | |
| Loans and receivables assessed for impairment | 19,593 | 3,303 | 2,751 | 552 | 17% |
| Collectively Assessed Portfolio | 3,576 | 822 | 512 | 310 | 23% |
| Total | 23,169 | 4,125 | 3,263 | 8625 | 18% |
Impairment is a key area of judgement in the NAMA financial statements. NAMA carries out a detailed impairment assessment of its loan portfolio on a semi-annual basis.
The 2013 year-end impairment review was based on:
- A detailed assessment of expected future cash flows for all debtor connections which are considered individually significant. These comprised 196 debtor connections with a carrying value of €19.6 billion (2012 €22.2 billion), representing all of the NAMA-managed debtor connections apart from a small number where circumstances did not allow the preparation of cash flow estimates. In total, a coverage rate of 85% (2012: 84%) was achieved.
- The expected future cash flows represent NAMA's best estimate of the cash flows that are projected to be generated by each individually significant debtor. They include estimated cash flows arising from the disposal of property collateral and non-disposal income (such as rental income).
- The remaining original loan book, representing a carrying value of €3.6 billion (2012: €4.1 billion), relates to debtors principally managed by the PIs which have not been individually assessed and which are grouped into a single portfolio for collective assessment. The collective assessment provision has been calculated based on an assessment of a representative sample of PI managed debtors.
The net increase in the specific impairment provision of €552m reflects a very detailed review undertaken by NAMA at end-2013 in respect of its individually assessed debtors and with a particular focus on the disposal value of property collateral scheduled for disposal during the period from 2014 to 2016. The Board decided to perform a detailed three-year review at end-2013 compared to a two-year detailed review at end-2012. Based on this assessment, NAMA has adjusted the disposal value of property collateral to reflect market movements since the cash flows were originally prepared (as part of the debtor business plan process) and to reflect also NAMA's current expectations based on market conditions and other available evidence.
The increase in the collective provision reflects a change in the loss rate applied to the collectively assessed debtors as a result of enhanced information on PI-managed debtor cash flows. During 2013, NAMA collated estimated future cash flows for all of the PI-managed debtors. It has used a representative sample of these cash flows to estimate the expected loss levels on this portfolio. The estimated loss rate on the collectively assessed portfolio based on a representative sample of cashflows is 23%, compared to 17% for the individually assessed portfolio and a prior year loss rate of 12.5% for the collectively assessed portfolio.
LOANS AND RECEIVABLES WITH NO OBJECTIVE EVIDENCE OF IMPAIRMENT
The principal balances within this category include:
- IBRC loan facility deed of €11.7 billion secured by a floating charge over certain IBRC assets. The loan facility deed will be repaid by the IBRC SL through the transfer to NAMA of cash following the completion of the sales process. The IBRC SL have completed the sales process and a large portion of the IBRC loan portfolio has been sold to the market. It is likely that the IBRC SL will remit sufficient cash to NAMA during 2014 to permit full redemption of the NAMA Senior Bonds issued to the Central Bank at the time of the IBRC liquidation.
- NAMA has advanced €373m in vendor finance to date (€357m to end-2013) to purchasers of assets being disposed of by NAMA debtors. All the vendor finance transactions are currently performing and as a result there is no evidence of impairment.
FINANCIAL POSITION
| Summary Balance Sheet |
2013 €m |
2012 €m |
|---|---|---|
| Assets | ||
| Cash, cash equivalents and liquid assets | 4,400 | 3,644 |
| Loans and receivables - NAMA | 19,598 | 22,776 |
| Loans and receivables - NARL | 11,716 | - |
| Other assets | 511 | 808 |
| Total assets | 36,225 | 27,228 |
| Liabilities and reserves | ||
| Senior Bonds in issue - NAMA | 22,690 | 25,440 |
| Senior Bonds in issue - NARL | 11,928 | - |
| Other liabilities | 797 | 1,376 |
| Total liabilities | 35,415 | 26,816 |
| Total equity and reserves | 810 | 412 |
| Equity, reserves and Liabilities | 36,225 | 27,228 |
CASH MANAGEMENT
NAMA, under its Board-approved Liquidity Policy, must ensure that it has adequate cash resources to meet all its financial obligations as they fall due, including new lending, debt-servicing costs and collateral payments. Cash requirement levels will vary during the financial year. At 31 December 2013, the NAMA Group had cash, cash equivalents and liquid assets of €4.4 billion, of which NARL accounted for €395m. Permitted liquid asset investments under the NAMA Liquidity Policy are short dated, comprising predominately Irish Government securities.
LOAN PORTFOLIO
NAMA acquired loans with an original par debt value of €74 billion from the PIs for a consideration of €31.8 billion. The NAMA carrying value of the loans at end-2013 is €19.6 billion (2012: €22.8 billion) (net of the cumulative €4.1 billion impairment provision (2012: €3.3 billion).
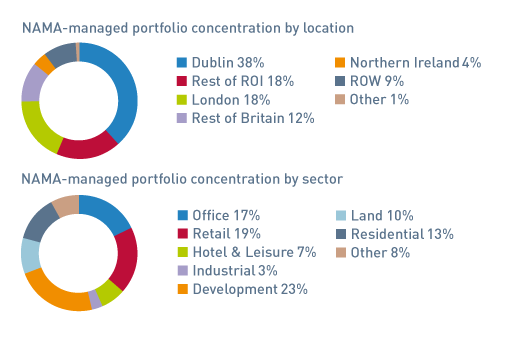
The concentration of the property portfolio securing NAMA's remaining loans by region and by sector is outlined in Figures K-M.
The analysis in Figure K shows that 56% of NAMA's remaining portfolio is concentrated in the Republic of Ireland with Dublin representing 38% of the total portfolio. As a result, the performance of the Dublin portfolio will be a crucial factor in NAMA's long term performance.
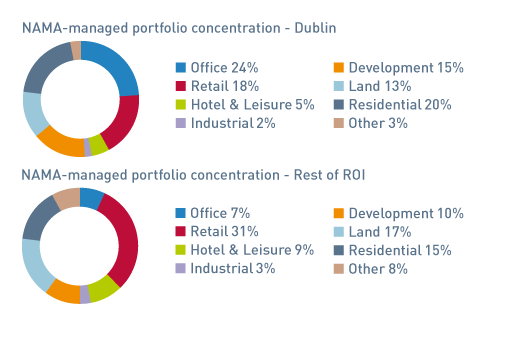
Of the Dublin portfolio (Figure L), the main segments are office 24%, residential 20% and land and development 28%. As noted in the business review, the Asset Management division has identified a number of prime Dublin development sites which are suitable for development through debtor funding or joint ventures in the future.
As regards the remaining portfolio in Ireland, there are significant concentrations in Cork, Galway and Limerick and in the counties close to Dublin. The main concentrations by sector outside of Dublin are retail 31%, land and development 27% and residential 15%.
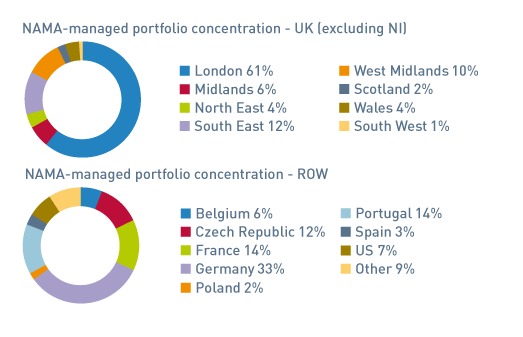
44% of NAMA's remaining portfolio is outside of Ireland. Britain accounts for 30% of the overall NAMA portfolio. Assets in London – predominantly large residential development projects - account for 18% of the total portfolio.
NAMA assesses its remaining portfolio on an ongoing basis. Planned asset disposals and expected cash flows from asset sales are updated and reported to management on a weekly basis.
| FIGURE K: NAMA-managed portfolio by location and sector – 31 December 2013 |
 |
| FIGURE L: NAMA-managed Dublin and Rest of ROI portfolio by sector – 31 December 2013 |
 |
| FIGURE M: NAMA-managed UK (excluding NI) and ROW portfolio by location – 31 December 2013 |
 |
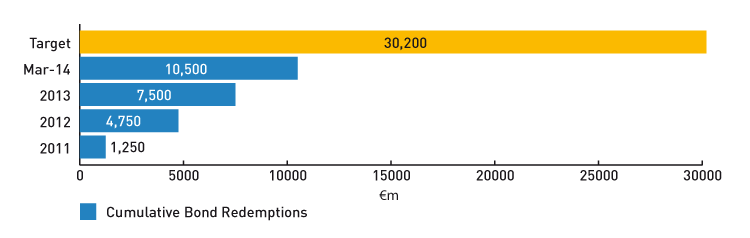
SENIOR BOND REDEMPTIONS
NAMA Senior Bond Redemption
By end-2013 NAMA achieved its Senior Bond redemption target of €7.5 billion in respect of its existing portfolio (25% of NAMA's original Senior Bond issuance).
By end-March 2014, NAMA had redeemed an additional €3 billion of its existing Senior Bonds bringing the cumulative Senior Bond redemption to €10.5 billion equivalent to 35% of the original Senior Bond issuance in 2010/2011. The €10.5 billion cumulative Senior Bond redemption as at end-March 2014 represents significant progress and puts NAMA in a strong position to redeem 50% of its Senior Bonds by the end of 2014.
| FIGURE N: Target bond redemption versus cumulative actual redemption - NAMA |
 |
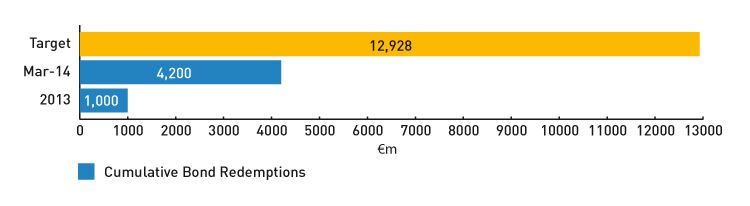
NARL Senior Bond Redemption
In addition in 2013 NAMA also redeemed €1 billion of the €12.9 billion of Senior Bonds issued in connection with the acquisition of the IBRC loan facility deed and floating charge. During 2014 NAMA has redeemed an additional €3.2 billion of the Senior Bonds issued in respect of the acquisition of the IBRC loan facility deed and floating charge bringing the cumulative redemption to €4.2 billion of the Senior Bonds issued in March 2013.
| FIGURE O: Target bond redemption versus cumulative actual redemption - NARL |
 |
A summary of the movement in loans and receivables is provided below:
| NAMA Debt 2013 €m |
Par Debt Value 2013 €m |
NAMA Debt 2012 €m |
Par Debt Value 2012 €m |
|
|---|---|---|---|---|
| Loans and receivables - opening balance | 22,776 | 70,812 | 25,607 | 72,463 |
| Cash receipts | (4,295) | (4,295) | (4,176) | (4,176) |
| Interest income | 1,058 | 1,973 | 1,222 | 2,430 |
| Loan acquisitions / valuation adjustments | 19 | 53 | (118) | 63 |
| Working capital advances | 665 | 665 | 308 | 308 |
| Profit on loan sales, property and surplus income | 502 | - | 188 | - |
| Loan sale movement | - | (261) | - | (55) |
| Foreign Exchange and other movements | (265) | (778) | 262 | 726 |
| 20,460 | 67,140 | 23,288 | 70,812 | |
| Impairment provision - incremental charge6 | (862) | - | (512) | - |
| Loans and Receivables - closing balance | 19,598 | 67,140 | 22,776 | 70,812 |